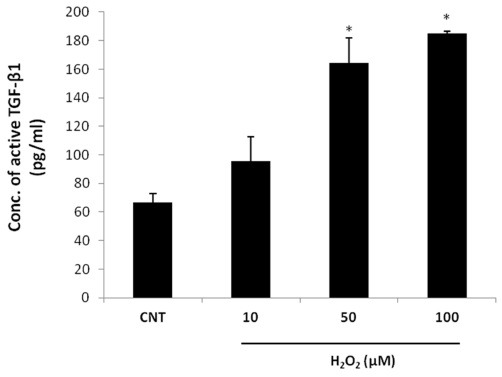
Fig. 2. Analysis of active TGF-β1 levels by ELISA after treatment with H2O2. The DP6-AR (5.0 × 10⁵ cells/dish) cells were treated with H2O2 at 10, 50, or 100 μM for 24 h and the conditioned media were harvested. Concentrations of the active form of TGF-β1 in the conditioned media were measured using a specific ELISA. All results are the mean values of experiments performed in triplicate. Error bars indicate standard errors. ANOVA was performed at first and independent t-test was done for post hoc. *P < 0.05 versus control. CNT, control; TGF-β1, transforming growth factor-β1.