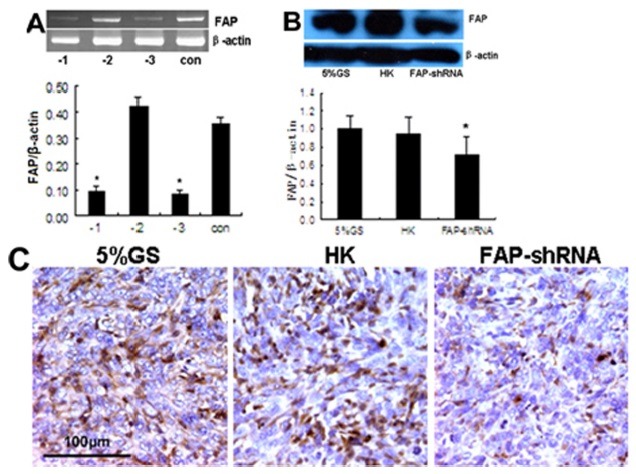
Fig. 1. RNAi-mediated knockdown of FAP in vitro and in vivo. (A) RT-PCR. Representative DNA bands of FAP and β-actin, as well as normalization of FAP to β-actin. Samples from culture cells transfected Si-m-FAP_001 (-1), Si-m-FAP_002 (-2), Si-m-FAP_ 003 (-3) and blank control (con). (B) Western blotting. Representative FAP and β-actin protein bands, as well as FAP expression normalized to β-actin. (C) Immunohistochemistry staining. Sections of 4T1 tumor tissue showing randomly selected representative areas. Magnification, 40×. *P < 0.05 compared with control groups.

