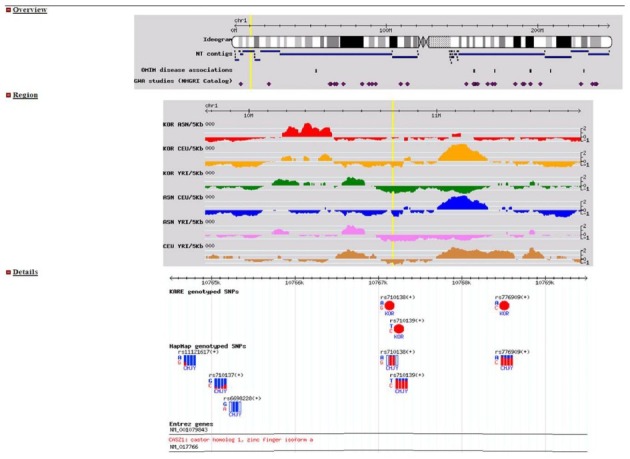
Fig. 3. A detailed screenshot showing EvoSNP-DB search results. Top track: chromosomal overview. SNP locations, diamond shapes. OMIM disease associations, rectangles. Second track: VarLD scores visualized along a 2 Mb chromosomal region. Third track: allele frequencies of SNPs, visualized as a pie chart for the Korean population or as towers for HapMap populations. Bottom track: Genes in the region.

