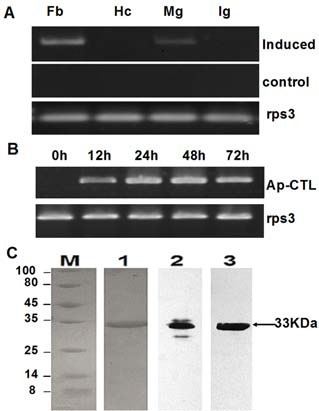
Fig. 2. Analysis of the mRNA expression of Ap-CTL and SDS-PAGE. (A) Semi-quantitative RT-PCR was performed to detect the mRNA level of Ap-CTL in response to challenges. (A) mRNA expression of Ap-CTL in different tissues: 5 μg total RNA from different tissues was obtained, including fat body (Fb), hemocytes (Hc), midgut (Mg) and integument (Ig) of challenged larvae. Tissues from naive larvae were extracted as negative controls. The same experiment was performed when detecting the mRNA expression of Ap-CTL challenged for different times (0, 12, 24, 48, 72 h) in fat body (B) A. pernyi ribosomal protein S3 (rps3) was used as an internal reference control. The average relative expressions were representative of three independent repeats ± 1 SD. (C) SDS-PAGE and western blot analysis of Ap-CTL. Lane M, molecular weight markers (shown on the left); lane 1, SDS-PAGE and Commassie Blue staining of recombinant CTL purified by Ni2+ affinity chromatography under denaturing conditions (0.5 μg). Lane 2 and 3, Immunoblot analysis of natural Ap-CTL of larvae plasma (15 μg) and recombinant CTL (0.3 μg) using antibody against Ap-rCTL, respectively. The arrow indicates the 33kDa Ap-CTL.

