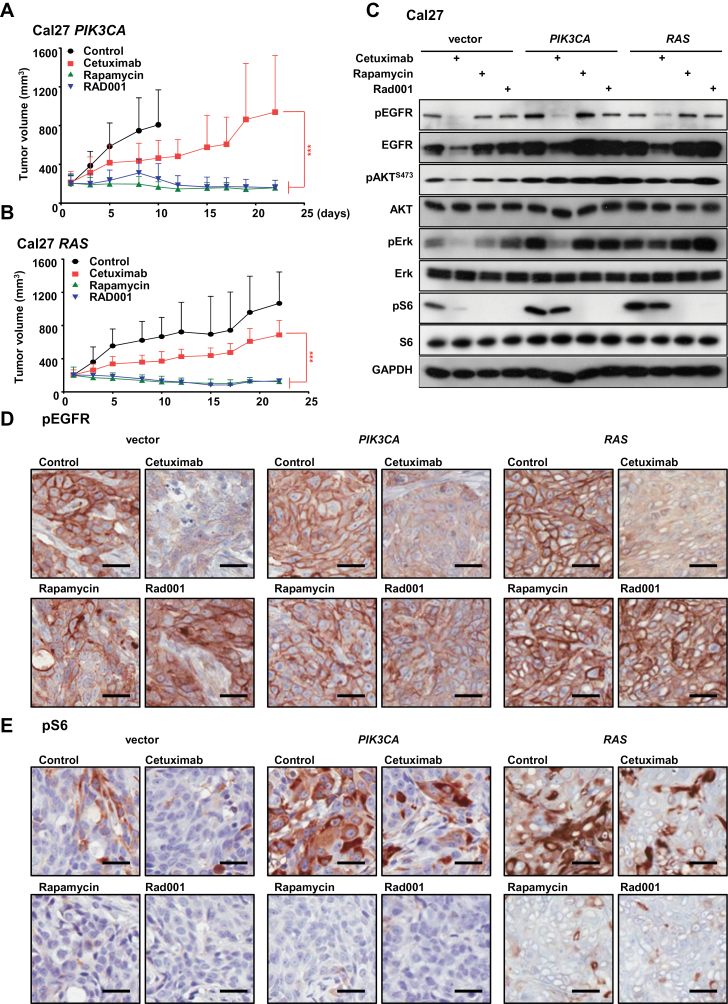
Figure 2.
Effect of mTOR inhibition on PIK3CA- and RAS-induced cetuximab resistance. A and B) The cetuximab-resistant Cal27 cells expressing PIK3CA and RAS (from Figure 1E) were transplanted into athymic mice. Mice were treated with cetuximab, rapamycin, or Rad001 as a single agent as indicated. *** P < .001 when comparing the rapamycin and Rad001 treated groups with cetuximab-treated mice (n = 10 per group). The tumor growth curves were compared by the longitudinal data analysis method (two-sided). For all panels, error bars represent standard deviation. C) Tumor-bearing mice were treated with cetuximab, rapamycin, or Rad001 for four days (short-term treatment) and tumor lysates were analyzed for pEGFR, EGFR, pAKT, AKT, pERK, ERK, pS6, S6, and GAPDH, as indicated. D and E) Representative immunohistochemical analysis of pEGFR and pS6 in the short-term treatment groups from panel C. Brown chromogen deposition reflects the immunoreactivity; hematoxylin was used as a nuclear counterstain (blue). Scale bars represent 25 µm.

