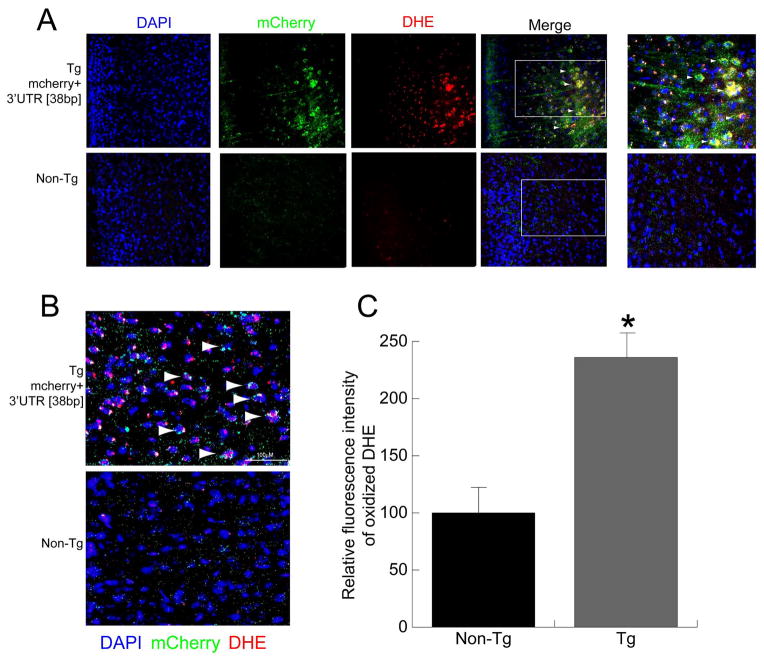
Figure 4.
Neurons expressing mCherry+3′UTR [38bp] transgene in the prefrontal cortex show elevated ROS levels. (A) Expression of the mCherry+3′UTR [38bp] in brain sections containing the prefrontal cortex from transgenic mice and non-transgenic littermates was detected by immunostaining with dsRED antibody and visualized by Alexa488 (Green) using fluorescence microscopy. The ROS levels in prefrontal cortex were visualized by oxidized DHE (red) in sections counterstained with 4′,6-diamidino-2-phenylindole (blue). (B) Confocal micrographs showing co-localization of mcherry (green) and DHE (red) fluorescence signals in the prefrontal cortex. Arrowheads show neurons that have mCherry expression (dsRED:Green), as well as elevated ROS levels (DHE: Red). The merged confocal images show a single optical section. (C) Relative ROS levels in prefrontal cortex neurons were quantified from fluorescence images and compared to the levels of ROS in non-transgenic littermates. Values represent the mean ± SEM. Students t test, *, p < 0.01.

