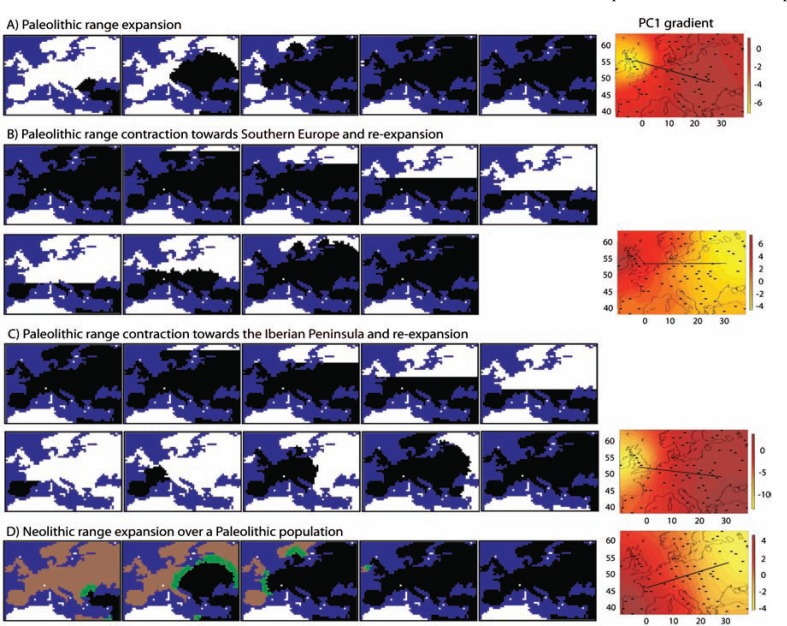
Fig. (2).
Illustrative examples of spatially explicit simulation of modern human colonization of Europe and principal component analysis derived from the simulated genetic diversity. Left: Snapshots of SPLATCHE2 to simulate an example of a: (A) Paleolithic range expansion over Europe; (B) Paleolithic range contraction towards Southern Europe and posterior re-expansion; (C) Paleolithic range contraction towards the Iberian Peninsula and posterior re-expansion; (D) Neolithic range expansion over Europe where the brown area is colonized by Paleolithic populations, the black area is colonized by Neolithic populations and the green region indicates a zone of cohabitation; at the end of this simulation Paleolithic populations are totally replaced by Neolithic populations. Settings (demographic parameter values) that we have applied to perform these simulations follow Arenas et al. [53]. The simulated population range expansions always start from the Middle East. Snapshots are taken each 50 generations. Right: Illustrative example of PC1 gradients for each above-described scenario. The black lines represent the PC1 gradient orientation, namely NW-SE for (A), W-E for (B), NW-SE for (C) and SW-NE for (D).

