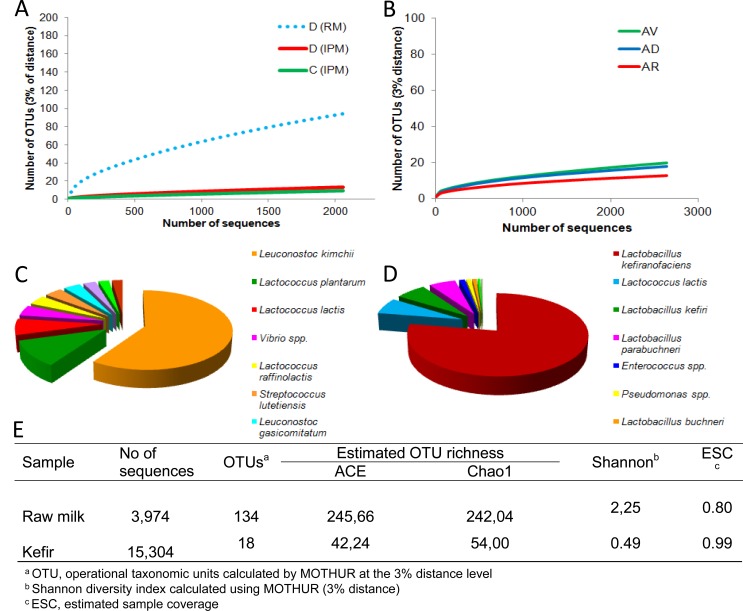
Fig. (2).
Rarefaction curves of raw milk (dotted blue line) and pasteurized milk samples incubated at 42ºC for 24 h (red and green lines (Panel A). Rarefaction curves of several samples of Brazilian kefir grains (Panel B). Schematic representation of the microbiota from raw milk (Panel C) and a kefir (Panel D) samples. Estimated OTU richness, sample coverage and diversity indexes are indicated on the table (Panel E) (data from Leite et al., 2012 and Delgado et al., 2013).

