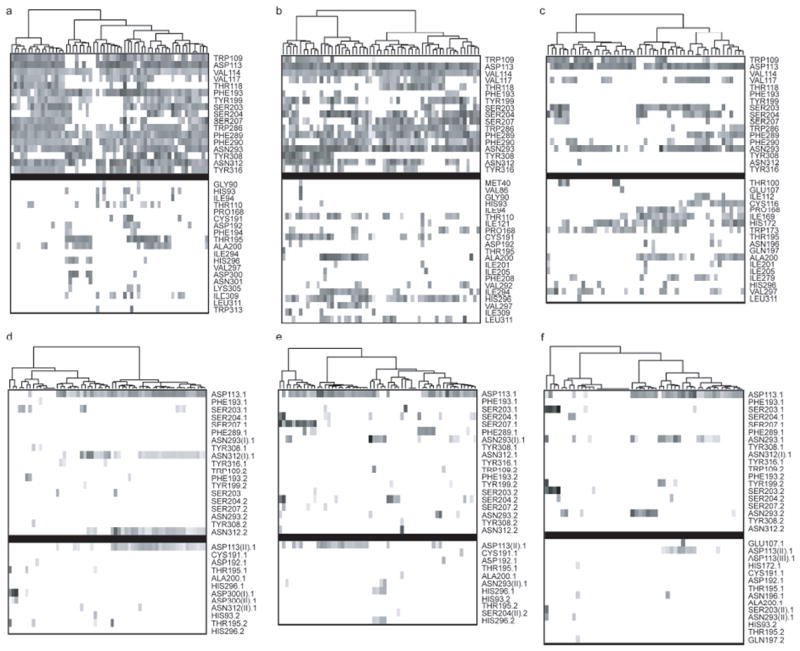
Figure 6.

The cluster analysis of the antagonists binding profile. (Upper panel, a-c) The comparison of weak interaction profiles of fifty-seven antagonists of human β2AR with 2RH1 (a), CM2 (b) and CM3 (c). (Lower panel, d-f) The comparison of hydrogen bonding (HBond) profiles of fifty-seven antagonists of human β2AR with 2RH1 (d), CM2 (e) and CM3 (f). The weak and HBond interactions were identified/scored by LigX module in MOE2007.09 and marked as X.1 for HBond donors and X.2 for HBond acceptors. In the case that one residue forms two HBonds to the ligand, the interactions were labeled as X(I).X or X(II).X, in which the X(I).X had the better score. The upper block in each map contains the binding pocket residues of 2RH1 while the lower block contains other interacting residues. Each point in the maps represents the identified interactions and was shaded by their respective scores, wherever darker indicates higher score and thus greater interaction strength. All the points in the map had been reorganized using hierarchical clustering by interaction scores.
