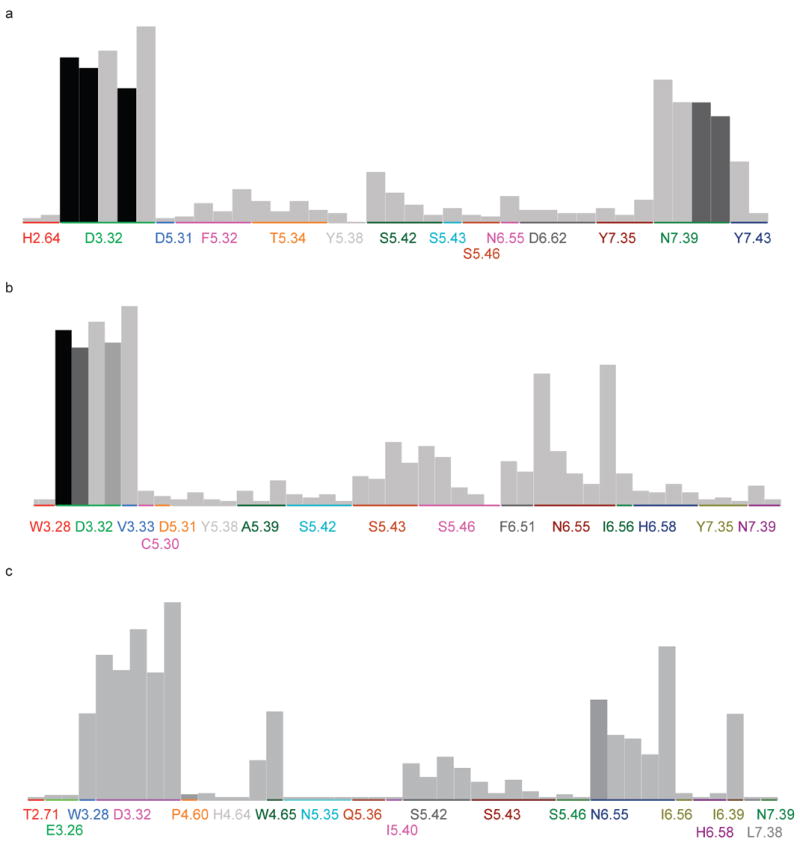
Figure 7.

The significance chart for PLIF fingerprints generated from docking poses against (a) β2AR crystal structure (2RH1), (b) CM2 model and (c) CM3 model. The higher the bar (individual fingerprint bit) is, more frequently this type of interaction occurs in the dataset and of higher probability it contributes to the activities. The shade of the color indicates the significance of the particular bit to the actives, which is based on the hypothesis that ‘if the bit is set, then the compound is active’. The residues are randomly colored and several bars of the same residue indicate that they have different types of contacts.
