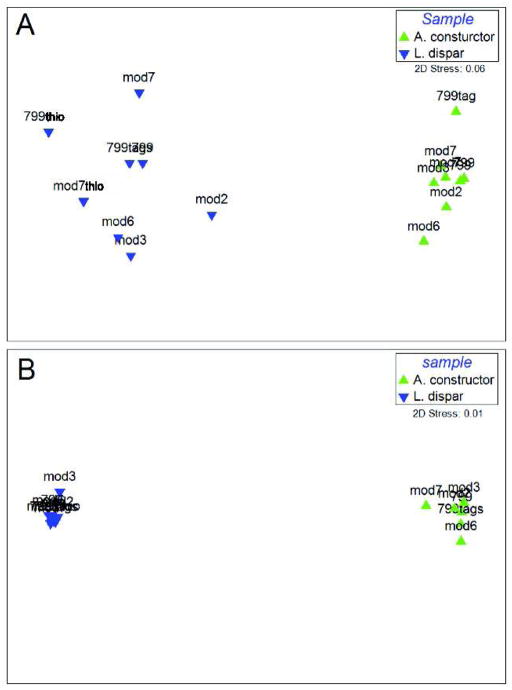
Fig 2.
MDS plot illustrating the differences between the bacterial communities in two arthropod samples sequenced with 8 primer pairs. Pairwise community distances determined using the unweighted Unifrac algorithm (A) and the weighted Unifrac algorithm (B). These two panels show that while there may be more bacterial taxa detected with different primers (A), when abundance is taken into account, the communities in each respective insect are nearly indistinguishable (B).

