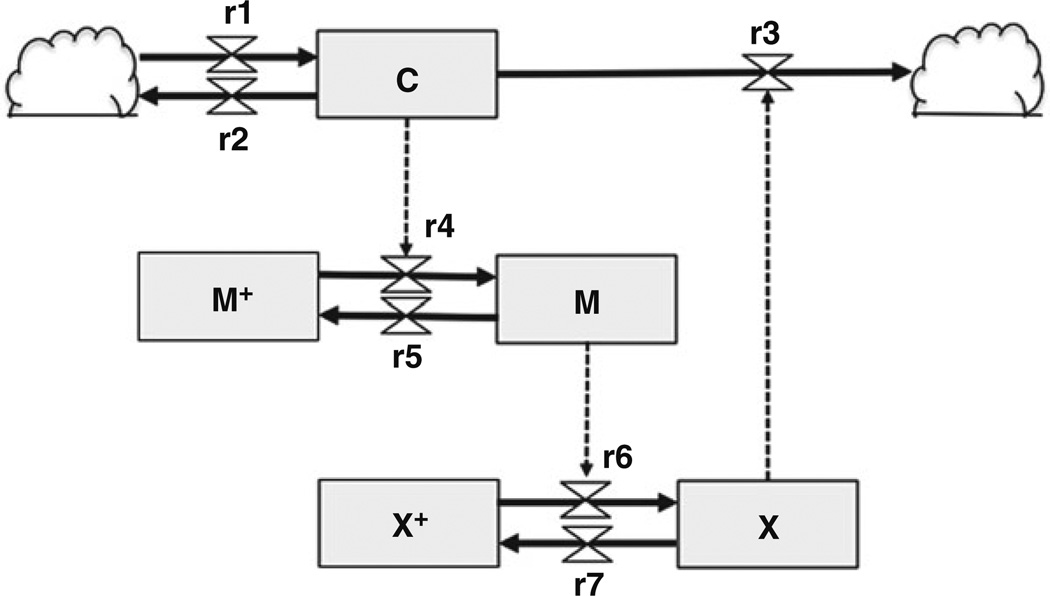
Fig. 1.
Schema for the mitotic oscillator from Goldbeter [8] using Forrester diagram notations. The state variables [Cyclin (C), maturation promotion factor (M), and protease (X)] are shown by boxes, with in- and outflows denoted by valves of defined molecular reaction rates. The cloud symbols represent sources or sinks, and dotted lines indicate regulatory connections

