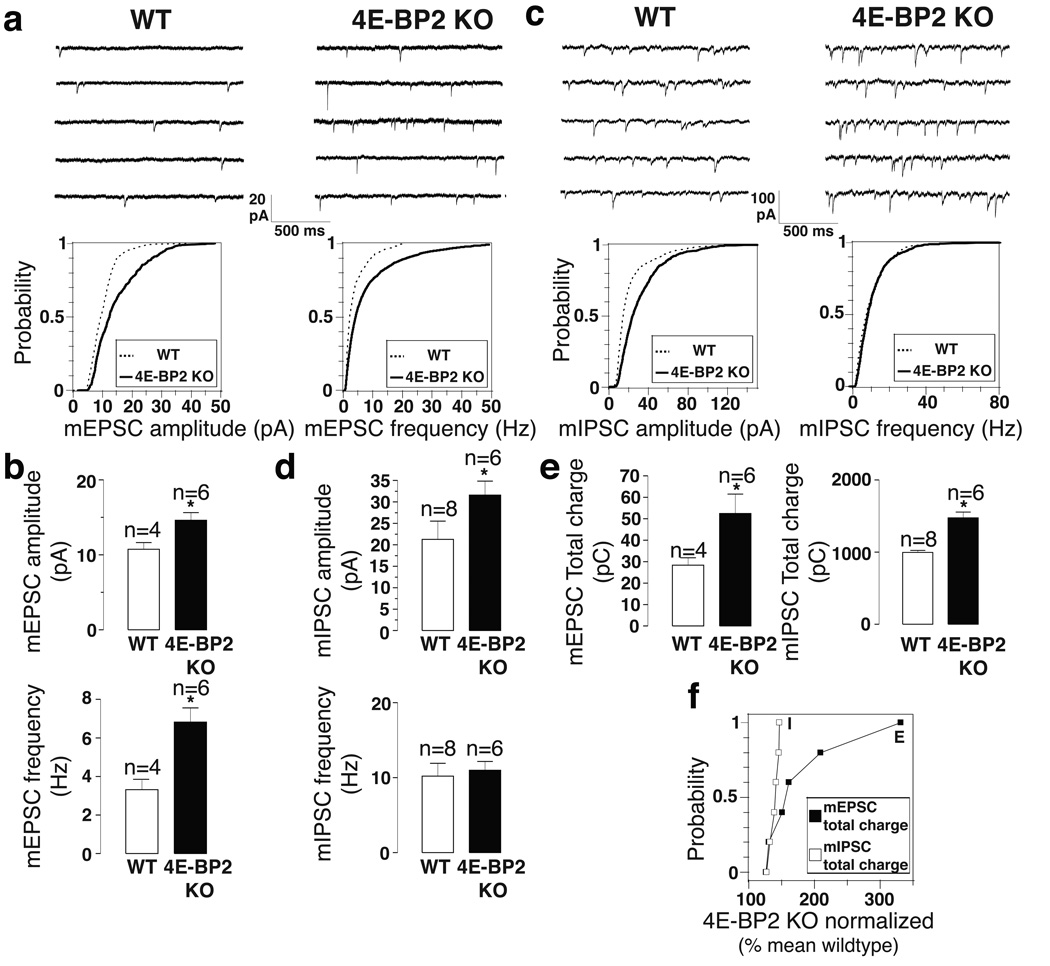
Figure 3. Excitation is increased to a larger extent than inhibition in 4E-BP2-KO mice.
(a, c) Representative traces (top) and cumulative distribution plots (bottom) of mEPSCs (a) and mIPSCs (c) from CA1 pyramidal in acute slices from WT and 4E-BP2−/− mice, illustrating changes in amplitude and frequency.
(b, d) Bar graphs showing mEPSC (b) and (d) IPSC amplitude and frequency (n=number of cells).
(e) Bar graphs showing the synaptic total charge transfer in 4E-BP2-KO relative to WT slices. For a-e, *p<0.05; one-way ANOVA with Bonferroni’s post-hoc.
(f) Relative changes in mEPSC and mIPSC total charge transfer, normalized to the mean WT value, for each neuron from 4E-BP2-KO slices; Kolmogorov-Smirnov test, p=0.005, KS statistic=0.916. Error-bars mean ±SEM.

