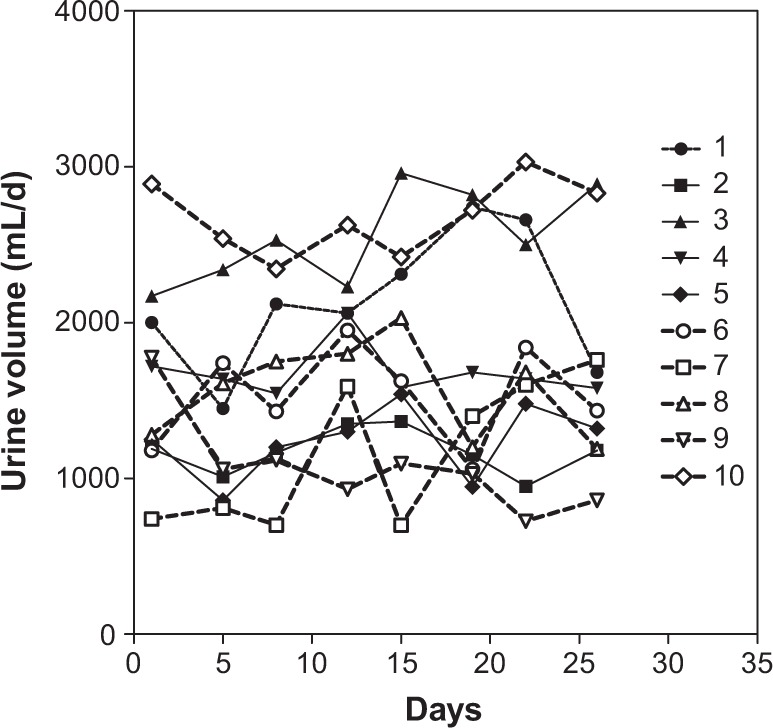
Figure 3.

Changes in urine volumes for each Japanese male subject during the study.
Notes: Each symbol represents the value for each subject. Numbers indicate the subject number.

Changes in urine volumes for each Japanese male subject during the study.
Notes: Each symbol represents the value for each subject. Numbers indicate the subject number.