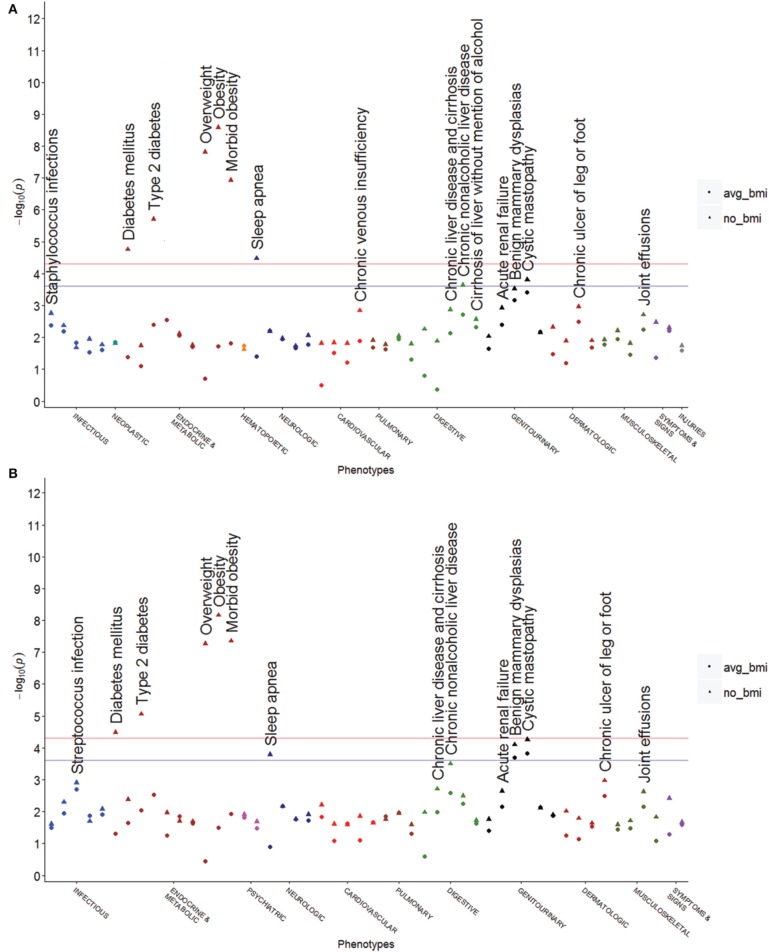
Figure 2.
PheWAS plots for other obesity associated SNPs in high LD with rs8050136. These plots show unadjusted values and the average BMI adjusted values on the same axis. These SNPs are associated with BMI and have different correlations with rs8050136. These SNPs are present in both datasets and are presented as meta-analyses below. The pink horizontal line represents p = 4.95 × 10⁻⁵, which is the Bonferroni correction, and the blue horizontal line represents an FDR q = 0.05 (p = 2.48 × 10⁻⁴). (A) rs9939609 is reported widely in the literature and has a nearly identical pattern of associations to rs8050136 (r2 = 0.96). (B) rs9941349 also has a similar pattern to rs8050136 but cystic mastopathy is marginally more associated (p = 5.41 × 10⁻⁵, OR = 0.81 before BMI adjustment) than in rs8050136 (r2 = 0.88).

