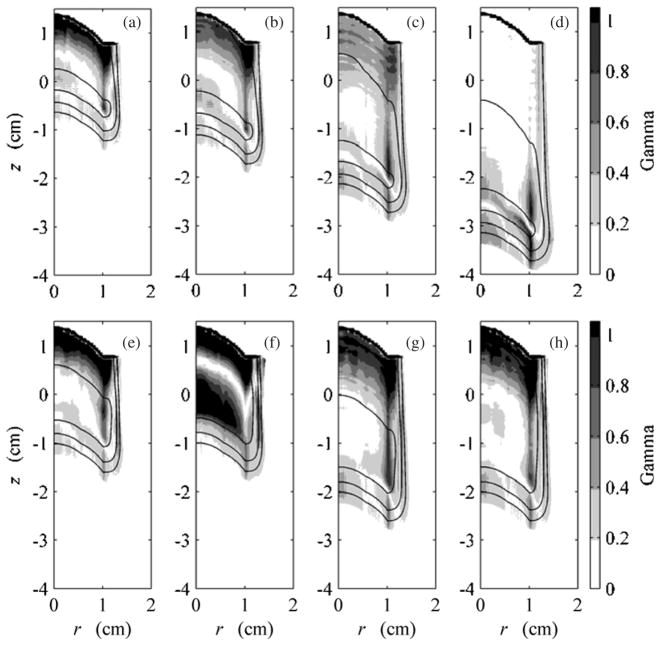
Figure 11.
Results of 2D comparison of MC and analytical calculations using the gamma function with 3% and 0.5 mm criteria. These comparisons include calculations performed on the eye model rotated clockwise 90° as shown in figure 10. Overlaid on each sub-figure are the 20% (outermost), 50% (middle) and 90% (innermost) isodose lines. All eight beams considered in this work are presented: (a) 1500, (b) 2000, (c) 3000, (d) 4000, (e) 2011, (f) 2020, (g) 3015 and (h) 3030 (see table 1). The MC data were adopted from Koch et al (2008).

