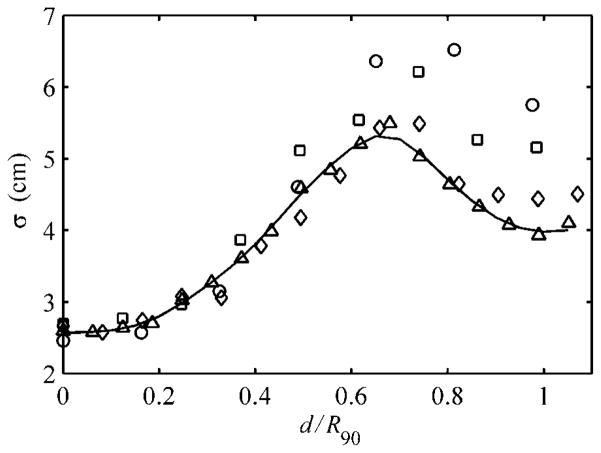
Figure 2.
The Gaussian widths, σ, of pristine beams versus the reduced range for the 1500 (circle), 2000 (square), 3000 (diamond) and 4000 (triangle) Bragg peaks. The fourth-order spline curve (solid line) was fit to the 4000 beam data and used in the analytical algorithm. Adapted from Koch (2006).

