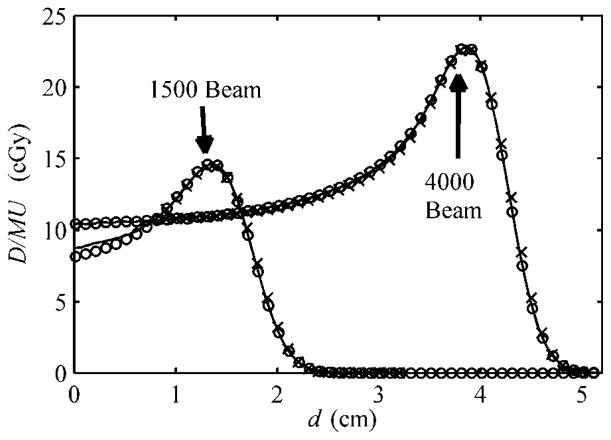
Figure 4.
The depth-dose profiles from calculations by MC (solid line), the analytical algorithm (open circle) and ionization chamber measurements (crosses) adapted from Koch et al (2008). Unmodulated beams with nominal ranges of 1.5 and 4 cm are indicated by the arrows according to the labeling described in table 1; they respectively represent the worst and best observed agreement among the unmodulated beams. The 4000 beam represents the open-beam condition described in the text and thus is more penetrating than modulated therapeutic beams. The Monte Carlo-calculated depth-dose profile of the 4000 beam is configuration data necessary for the analytical algorithm. The units shown are absolute dose per monitor unit (D/MU) and water-equivalent depth (d). The MC and measured data were adopted from Koch et al (2008).

