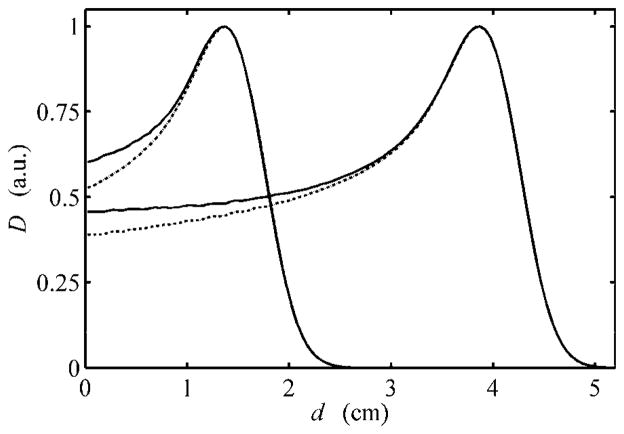
Figure 8.
Dose depth profiles of the 1500 and 4000 beams normalized to their respective peak dose (D) values versus water-equivalent depth (d). The MC data for the 1500 and 4000 beams shown in figure 4 are shown normalized to their peak dose values here (solid lines). Contrasted with these results are the corresponding depth profiles obtained when all proton histories that interact with any collimator component are terminated (dotted lines), with the key differences occurring in the proximal region of the Bragg peak. Adopted from Koch (2006)

