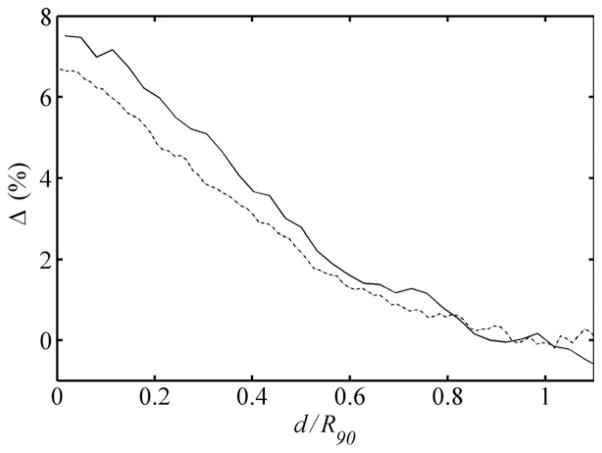
Figure 9.
Differences observed in the 1500 (solid line) and 4000 (dotted line) beams, in terms of percentage of the peak dose, for the corresponding profiles shown in figure 8 that were generated from the simulation conditions including and excluding protons scattered by the collimation system of the ocular nozzle. These differences are plotted versus the reduced range, i.e. the ratio of the water-equivalent depth (d) to the water-equivalent range of the beam to the distal 90% isodose level, R90. Adopted from Koch (2006)

