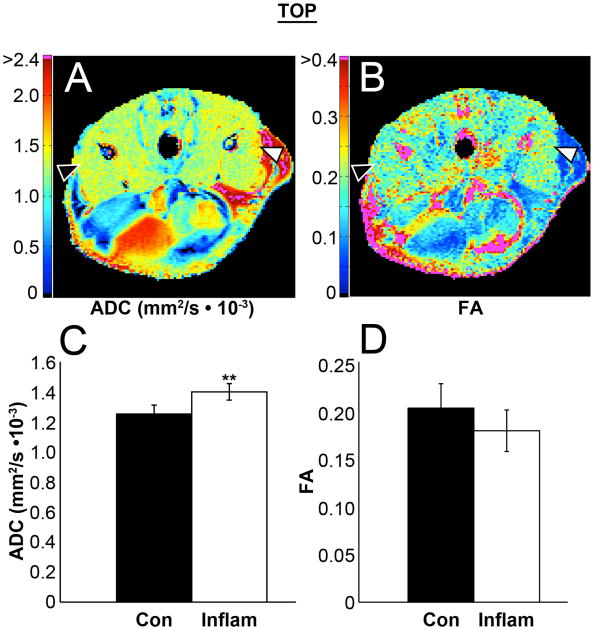
Figure 4.
Diffusion tensor imaging data was collected, using 10 directions of diffusion sensitive gradients. Tensors were calculated both per individual voxel for qualitative parameter maps of ADC (A) and FA (B), and from the ROI signal mean from each of the DW-images for group comparisons of the Eigen values and the ADC (C) and FA (D). All of the Eigen values and the ADC were significantly increased in the inflamed muscle. Note that regions of low SNR due to fat saturation can result in overestimated FA values (magenta regions in subcutaneous fat and bone; panel B).

