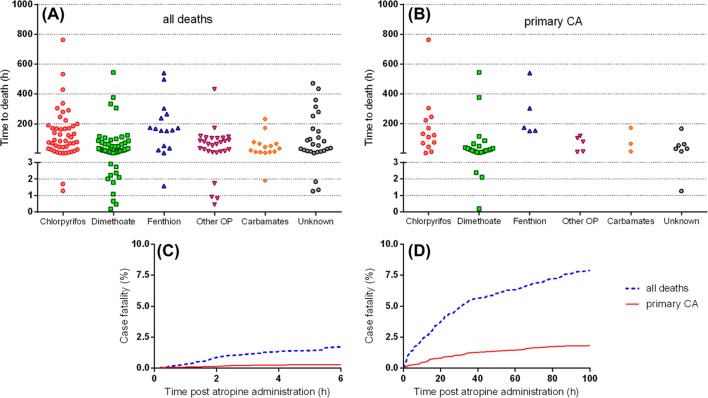
Fig. 2.
Plot of time from admission to death for each patient (A and B) and cumulative percentage of death post admission (C and D). A: patients with any cause of death. B: patients dying from a primary cardiac arrest. See Table 1 legend for a list of other OP insecticides. Cumulative percentage of patients who died with any cause of death (broken blue), and patients dying from a primary cardiac arrest (solid red). C: up to 6 h post atropine administration; D: up to 100 h post atropine administration (colour version of this figure can be found in the online version at www.informahealthcare.com/ctx).

