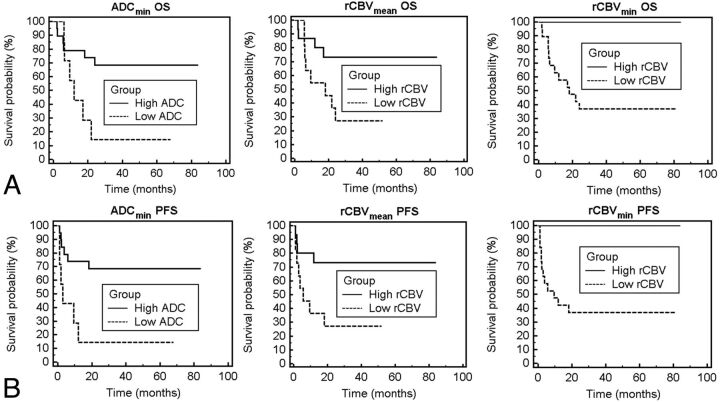
Fig 1.
Overall survival and progression-free survival probability based on ADC or rCBV measurements. A and D, Patient outcome as a function of ADCmin stratification into low and high groups. Kaplan-Meier analysis (A) of OS for patients stratified into the low group (ADCmin < 384, dashed line) with a mean survival of 12.1 months versus those stratified into the high group (ADCmin ≥ 384, solid line) with a mean survival time of 20.1 months (P = .02, logrank test). Kaplan-Meier plot (D) of PFS stratified into the same low group (ADCmin < 384, dashed line) with a mean progression time of 13.8 months versus those stratified into the high group (ADCmin ≥ 384, solid line) with a mean progression time of 38.9 months (P < .01, logrank test). B and E, Patient outcome as a function of rCBVmean shows a statistically significant difference in OS and PFS between low (rCBVmean < 1.43) and high (rCBVmean ≥ 1.43) groups (P = .03, logrank test for OS; P = .03, logrank test for PFS). C and F, Patient outcome as a function of rCBVmin shows a statistically significant difference in OS and PFS between low (rCBVmin < 0.56) and high (rCBVmin ≥ 0.56) groups (P = .01, logrank test for OS; P < .01, logrank test for PFS).

