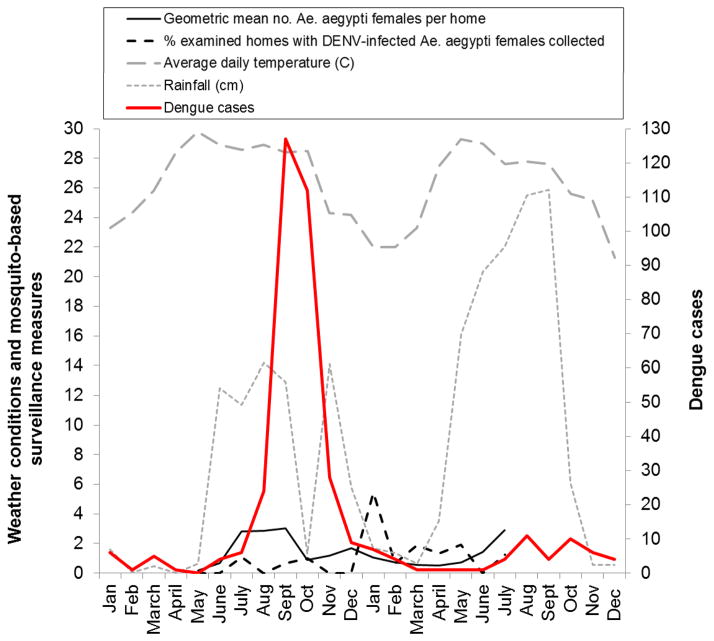
Figure 1.
Temporal curves for monthly numbers during 2009–2010 of reported dengue cases in the Mérida City study neighborhoods, weather conditions (total monthly rainfall and monthly average daily temperature), an entomological index (monthly geometric mean number of Ae. aegypti females collected per home) and a mosquito-based DENV surveillance measure (monthly percentage of examined homes from which at least one DENV-infected Ae. aegypti female was collected).

