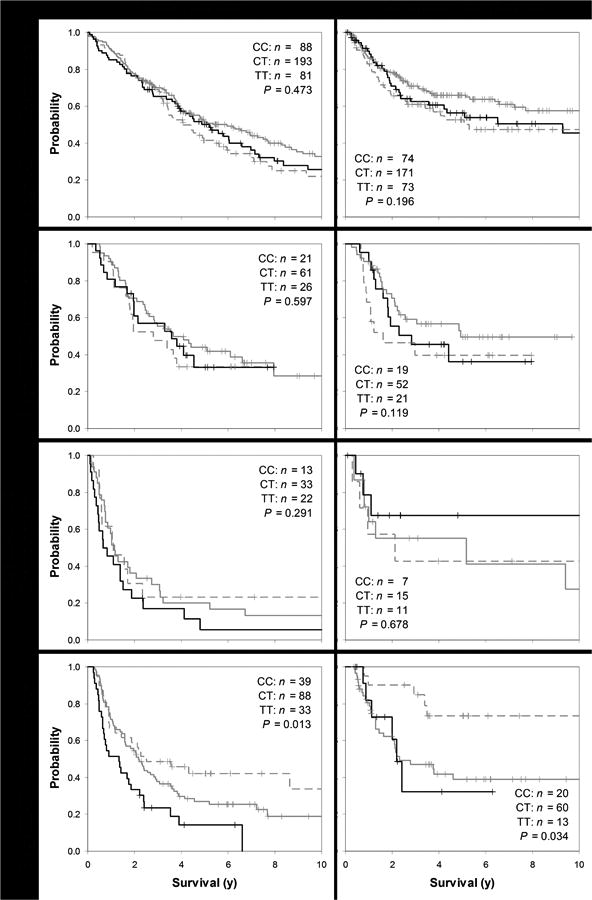
Figure 1.

Overall (left hand plots) and recurrence-free survival (right hand plots; Kaplan-Meier plots, showing sample counts and statistical significance according to Wilcoxon-weighted log-rank test p-values) for each of 4 lung cancer subgroups, by stage and treatment, from top most to bottom most plots: stage I-II not given chemotherapy, stage I-II given chemotherapy, stage III-IV not given chemotherapy, and stage III-IV given chemotherapy, according to ABCB1 rs2235013 genotype (CC in black, CT in solid gray, and TT in dashed gray). Plus ("+") symbols signify censored observations.
