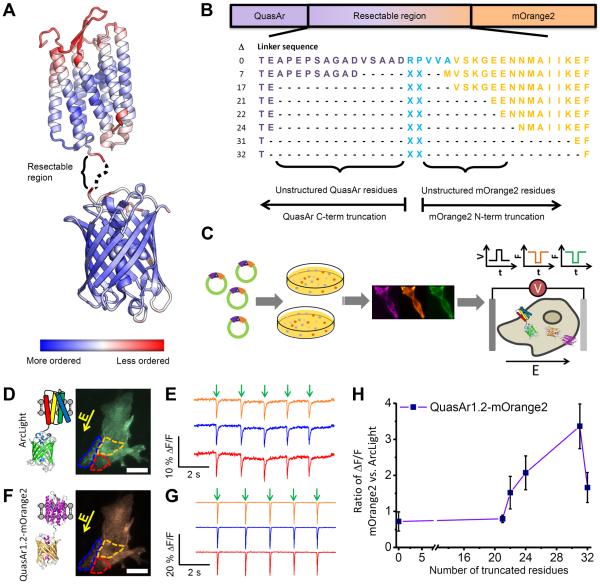
Figure 2. Directed evolution of an eFRET GEVI.
A) A model of QuasAr-mOrange2 constructs, represented by the crystal structures of Arch-2 (PDB ID 2EI4) 26 and mOrange (PDB ID 2H5O) 27. The color scale represents the degree of order in the crystal structure, as reported by the B-factor. Less ordered regions are presumed more dispensable. B) Design of linker truncation libraries. QuasAr1.2, the best available variant at the time of the screen, was used as the electrochromic quencher. C) Hierarchical screen of truncated linker libraries for eFRET GEVIs. Constructs were first screened in E. coli for mOrange2 brightness and then screened for membrane trafficking in HEK cells. Voltage-sensitivity was then tested via field stimulation in HeLa cells co-expressing the eFRET GEVI, ArcLight (as an internal control), and Kir2.1 (to lower the resting voltage to −60 mV 42). D) ArcLight fluorescence of three HeLa cells. Yellow arrow indicates direction of the applied electric field. Scale bar: 25 μm. E) Fluorescence intensity traces of the three regions shown in D). F) mOrange2 fluorescence from the same cells shown in D). G) Response of mOrange2 fluorescence during stimulation as in E). Fluorescence traces show single-trial measurement of cells imaged at 100 frames per second. H) Effect of linker length on voltage sensitivity in QuasAr1.2-mOrange2. For each linker length the most sensitive eFRET GEVI construct was compared to ArcLight measured in the same cells. Error bars represent standard deviation over n = 15–20 cells in the ratio ΔF/F.

