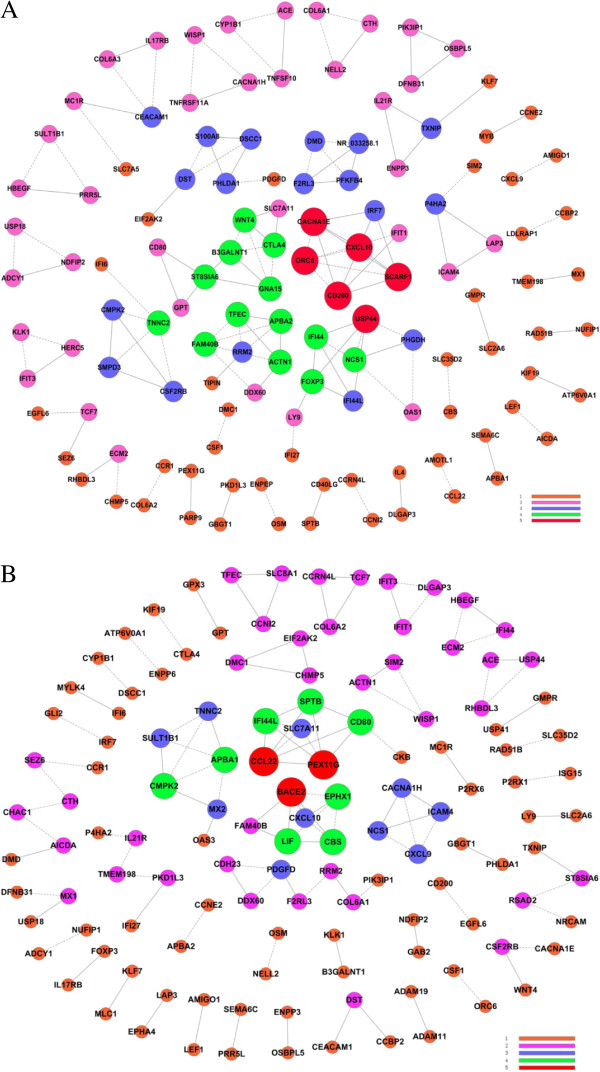
Figure 6.

Gene co-expression network analysis. (A) CIKIL-15; (B) CIKIL-2; Degree in different color is defined as the link numbers one node has with the other. The Pearson Correlation of each pair of genes were calculated from these three independent samples.
