
Figure 7.
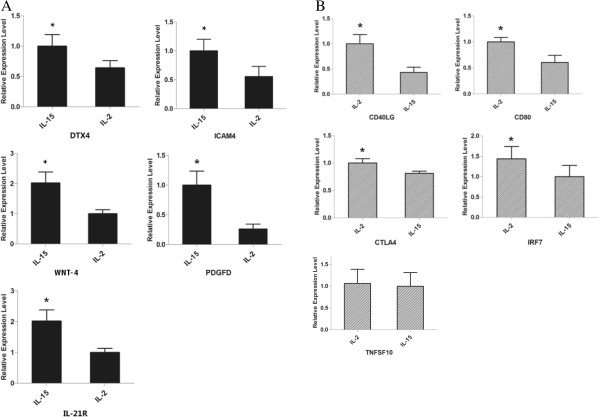
qRT-PCR validation of relative expression levels of representative DEGs. (A) DEGs in CIKIL-15; (B) DEGs in CIKIL-2; the expression levels of corresponding genes were normalized by β-actin. The results were means and SEMs, representative of nine independent samples. (P < 0.05 in all DEGs except TNSF10).