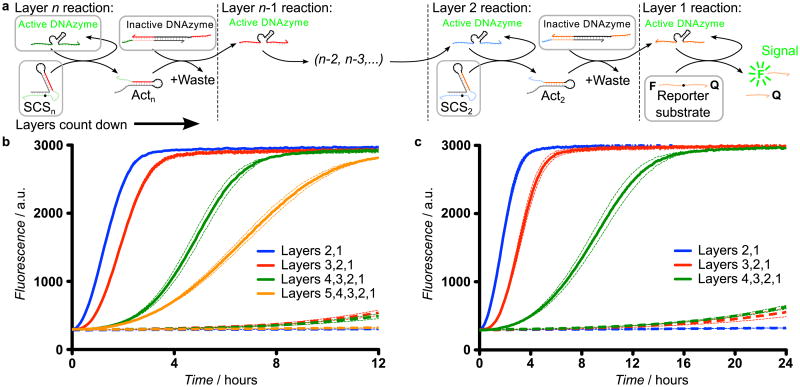
Figure 2.
Demonstration of DNAzyme signaling cascades. a) Schematic of multi-layer DNAzyme signaling cascades using DNAzyme displacement reactions. Initial species for each layer of the cascade are highlighted in grey boxes. In each layer, an active DNAzyme cleaves the corresponding SCS, producing an activator that releases the downstream DNAzyme from its catalytically inactive enzyme-inhibitor complex via a DNAzyme displacement reaction, thereby propagating the activating signal to the next layer of the cascade. b) The mean fluorescence signal (solid lines) from two-layer (blue), three-layer (red), four-layer (green) and five-layer (orange) linear DNAzyme signaling cascades with equimolar (100 nM) DNAzyme concentrations in each layer. The dashed line represents the same reaction without the top-layer active DNAzyme, which measures the non-specific activation (leakage) of the downstream circuit. The dotted lines represent the 95% confidence interval from three replicate experiments. c) Kinetic traces for multi-layer linear DNAzyme signaling cascades with increasing DNAzyme concentrations in each layer (25 nM in layer 4, 50 nM in layer 3, 75 nM in layer 2, and 100 nM in layer 1) to demonstrate signal amplification. In both plots, dotted lines represent the 95% confidence interval from three replicate experiments.

