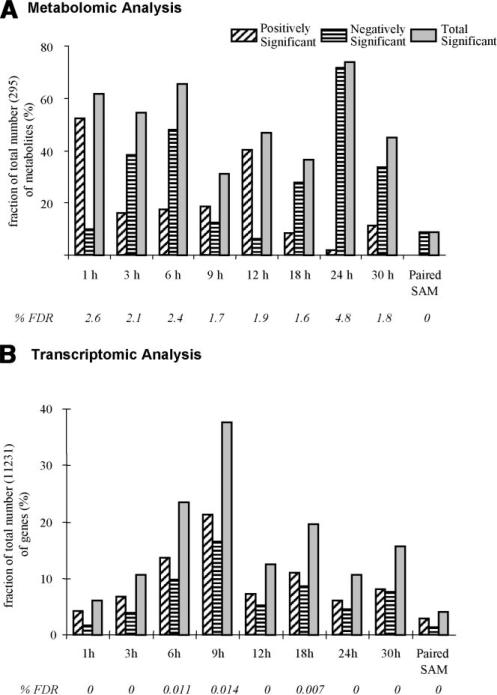
Figure 1.
Number of positively and negatively significant (A) metabolites and (B) genes at each time point (based on MiTimeS) and from paired-SAM (see Materials and Methods Section). MiTimeS and paired-SAM analyses of the metabolomic profiles were both based on the same significance threshold (delta) value of 1.2, while for the MiTimeS and paired-SAM analyses of the transcriptomic profiles the delta value was 0.9. The median% false discovery rate (FDR) of each analysis is also shown.

