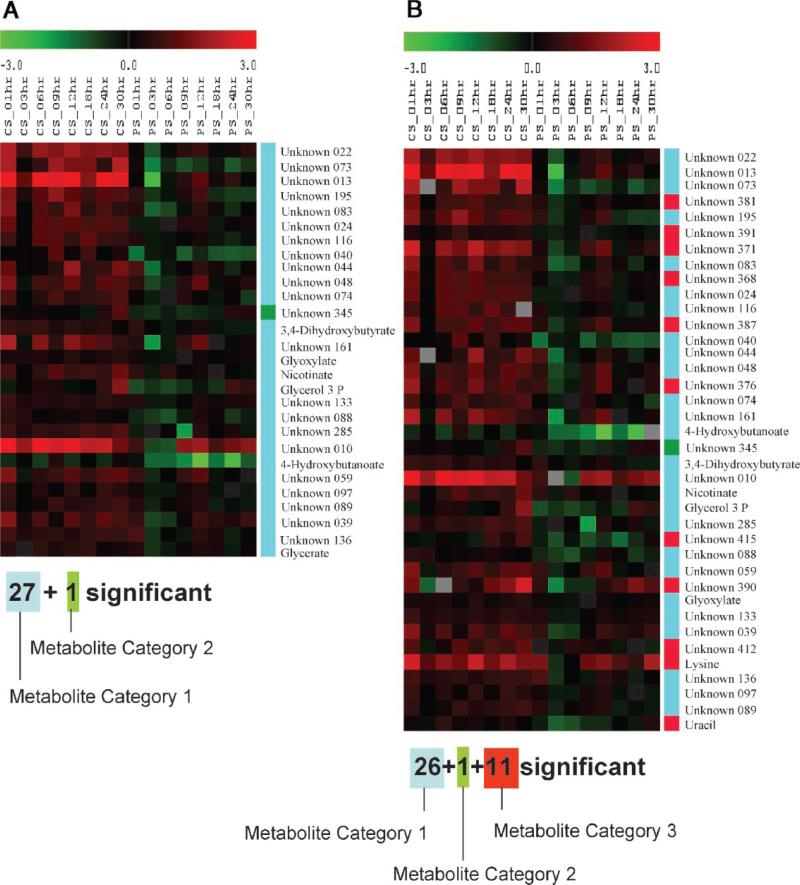
Figure 10.
The metabolite peak areas which were identified as significant by paired-SAM (0% FDR (median)) when the data correction strategy described in Kanani and Klapa (2007); (A) was, and (B) was not used. Each row of the depicted A and B tables corresponds to a metabolite identified as negatively significant in case A and B, respectively. Eleven metabolite peak areas (two annotated) would have been falsely identified as significant in case B. The color of each element of the table is proportional to the normalized with respect to 0 h relative peak area of the corresponding metabolite (row) in the sample that corresponds to the particular column (see Materials and Methods Section). CS, PS depict, respectively, the control and perturbed samples. The unknown metabolites are named based on their numbering in supplementary Table I. The tables were generated in TIGR MeV (v.3.1). Definition of metabolite category 1, 2, and 3 is provided in Appendix A.

