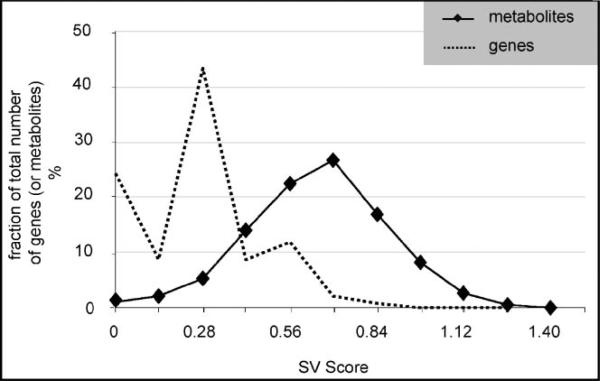
Figure 2.
Significance Variability (SV) score distribution of metabolomic and transcriptomic data. A gene's or metabolite's SV score (Dutta et al., 2007) is a measure of the gene's (or metabolite's) significance level variability over time. Based on its definition, the SV score could range from 0 to 2; zero SV score means that the gene (or metabolite) belongs to the same significance level throughout all time points, while SV score = 2 means that the gene (or metabolite) fluctuates between the positively and negatively significance level throughout the duration of the experiment.

