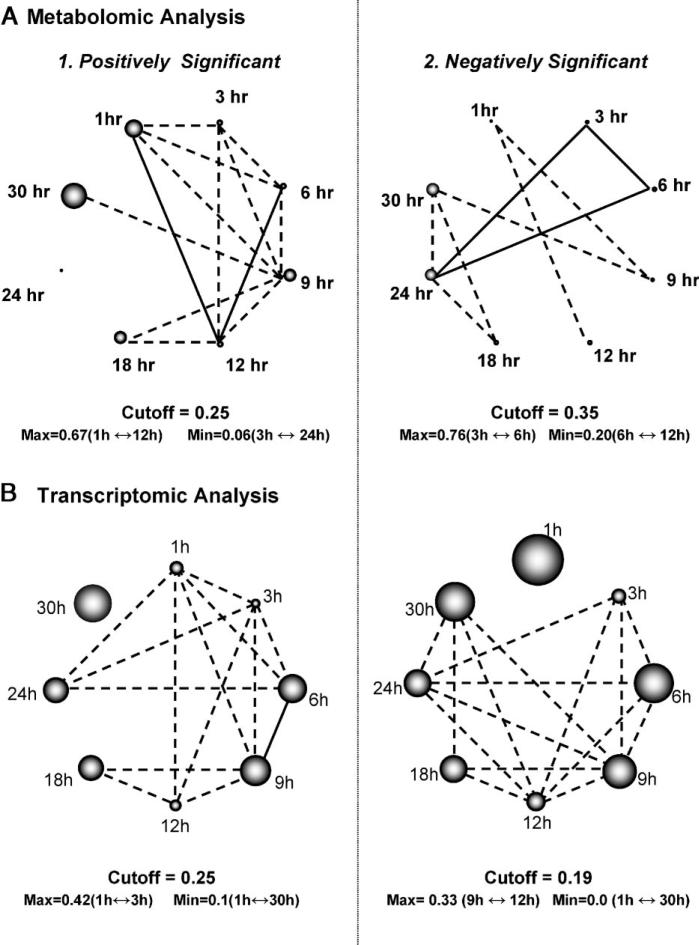
Figure 3.
Time point correlation networks based on the common between time points (A1) positively significant metabolites, (A2) negatively significant metabolites, (B1) positively significant genes, and (B2) negatively significant genes. The correlation coefficient between two time points based on significant metabolites or genes is estimated as described in the Materials and Methods section [and in detail in (Dutta et al., 2007)]. In the shown networks, two time points are connected, if their correlation coefficient is larger than the mean correlation coefficient between any two time points (indicated cutoff threshold). If the correlation coefficient between two time points is larger than 0.5, then they are connected through a straight line; otherwise the line is dashed. The diameter of the sphere representing each time point in the positively or negative significant correlation networks is, respectively, proportional to the fraction of metabolites or genes that are positively or negatively significant only at that time point [see Materials and Methods section]. Thus, the wider the sphere the larger the number of (positively or negatively) significant changes at the transcriptional (or metabolic) level that are uniquely observed at the particular time point.

