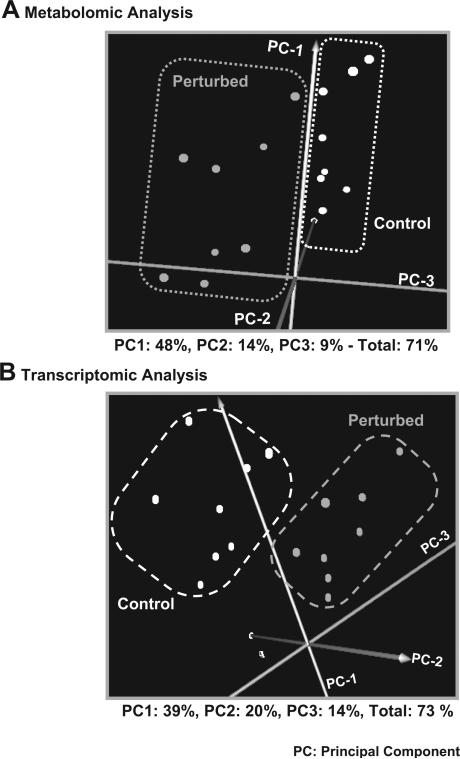
Figure 4.
Principal component analysis (PCA) of the (A) metabolomic and (B) transcriptomic data. Each point on the graphs represents the metabolomic (A) or transcriptomic (B) profile of the control or perturbed plant liquid cultures sets at a particular time point. The control and perturbed culture sets are separated based on their metabolomic (A) and transcriptomic (B) profiles, indicating that both the transcriptional and metabolic activity are affected by the applied perturbation even during the first 30 h of the applied treatment.

