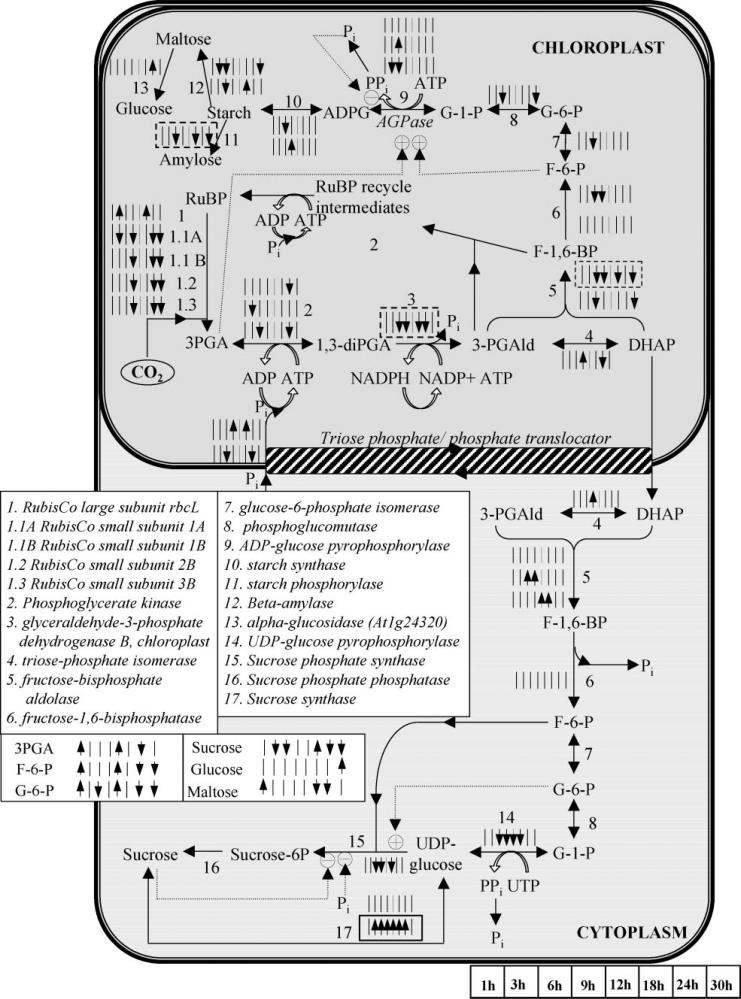
Figure 6.
The significance level profiles over time and the significance classification based on paired-SAM of the genes and metabolites in the Calvin cycle, starch and sucrose biosynthesis pathways that were included in the analysis. The transcriptional information is compartmentalized as shown in the figure, i.e., all shown genes are expressed in the particular compartments. The significance level profiles of metabolites that participate in these pathways are shown outside of the compartments, because they refer to the net over the entire liquid culture (i.e., over all compartments, tissue and cell types) metabolite pool size. Positively and negatively significant genes and metabolites are designated as described in the caption of Figure 5. Information about the depicted pathways’ structure was obtained from the KEGG database (www.kegg.com) and Buchanan et al. (2001). Dotted lines depict positive or negative regulation depending on the sign. (This figure can be viewed online in a color version as Supplementary Figure 2.)

