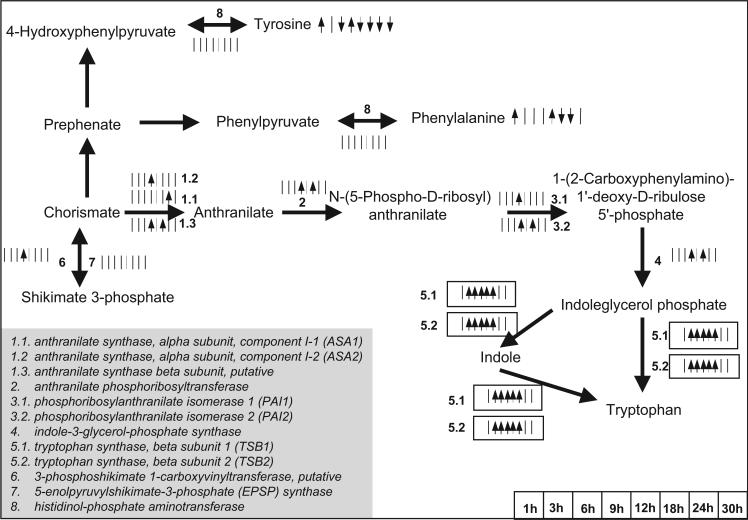
Figure 8.
The significance level profiles over time and the significance classification based on paired-SAM of the genes and metabolites in the aromatic amino acid biosynthesis pathways that were included in the analysis. Positively and negatively significant genes and metabolites are designated as described in the caption of Figure 5. Information about the depicted pathway's structure was obtained from the KEGG database (www.kegg.com) and Buchanan et al. (2001). (This figure can be viewed online in a color version as Supplementary Figure 3.)

