
Figure 8.
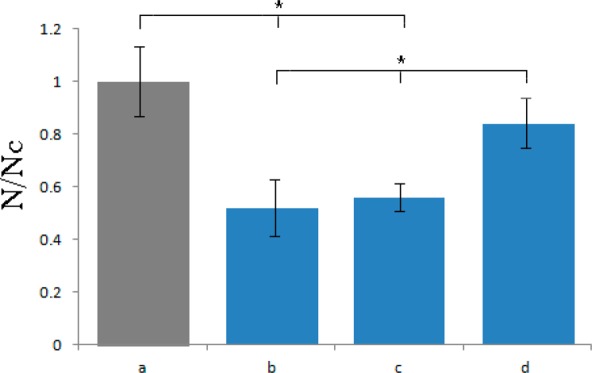
Migration assay for MC3T3-E1 cells onto control cell culture borosilicate glass (a) and onto different PCL/HAp films, (b) topographically ordered, (c) topographically disordered and (d) flat, after 3 days of incubation. Migration density is represented as a number of cells counted per surface area for a given sample (N) normalized to the number of cells per surface area for the control sample (Nc). Statistically significant difference (p < 0.05) is denoted with *.