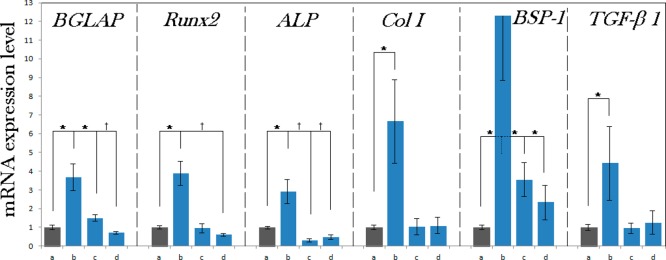
Figure 9.

Normalized mRNA expression of six different osteogenic markers in MC3T3-E1 cells grown on control cell culture polystyrene (a) and on different PCL/HAp films, (b) topographically ordered, (c) topographically disordered and (d) flat, after 96 h of incubation. mRNA expression was detected by quantitative RT-polymerase chain reaction relative to the housekeeping gene β-actin (ACTB). Data normalized to the expression of ACTB are shown as averages with error bars representing standard deviation. Genes significantly (p < 0.05) upregulated with respect to the control group are marked with *. Genes significantly (p < 0.05) downregulated with respect to the control group are marked with †.
