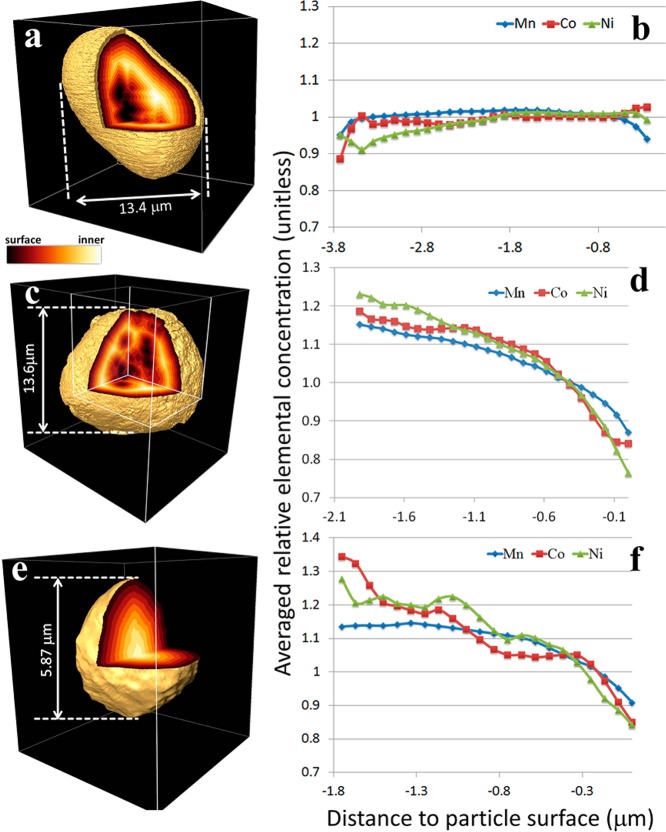
Figure 5.
“3D distance maps” of a pristine LMR NMC particle (panel a) and two 1×-cycled particles (panels c and e). The value of every voxel represents the shortest distance to a surface (outer surface and/or surface of macro pores inside the particle), visualized via virtual segmentation. The color legend indicates the relative value of the distance from each individual voxel to the surface of the particles. The corresponding averaged relative elemental concentrations of all three TMs (Mn in blue, Co in red, and Ni in green) are plotted as a function of the distance to the particle surface (panels b, d, and f). (See Supporting Information for calculation method.) Lower levels of TMs at surfaces are observed in the 1×-cycled particles (panels d and f) but TMs are more uniformly distributed in the pristine (panel b).

