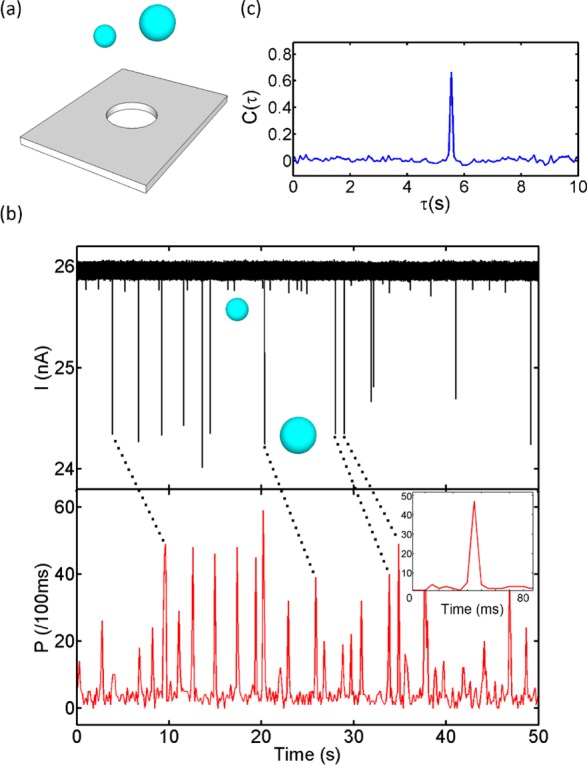
Figure 2.

Gated electro-optical detection of single nanobeads. (a) Fluorescent nanobeads of two different diameters (100/200 nm) are translocated through a 250 nm nanopore. (b) Electrical blockade (top) and optical fluorescence (bottom) signals showing correlated single-particle detection events (four examples are highlighted with dashed lines). The inset shows a zoomed-in view of the optical signal with average width of 8 μs. (c) Cross-correlation of the electrical and optical signals, C(τ), which shows a single peak that enables accurate determination of the flow velocity in the waveguide channel. The particle translocation rate was 35.6 particles/min, but rates in excess of 1000 particles/s are possible.25
