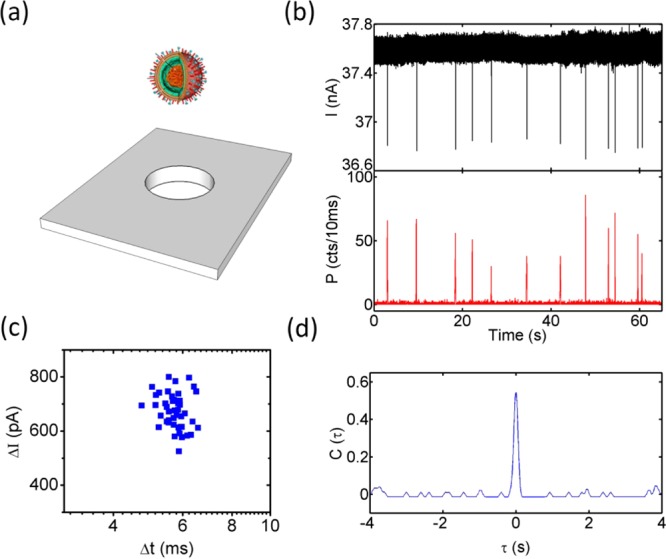
Figure 4.

Electro-optical detection of single H1N1 influenza A viruses. (a) Schematic view of 120 nm virus particles and the 157 nm nanopore. (b) Electrical blockade (top) and optical fluorescence (bottom) signals showing correlated single-virus detection events. (c) Scatter plot of electrical signals showing narrowly distributed blockade depths and dwell times. (d) Cross-correlation of the optical and electrical virus detection signals.
