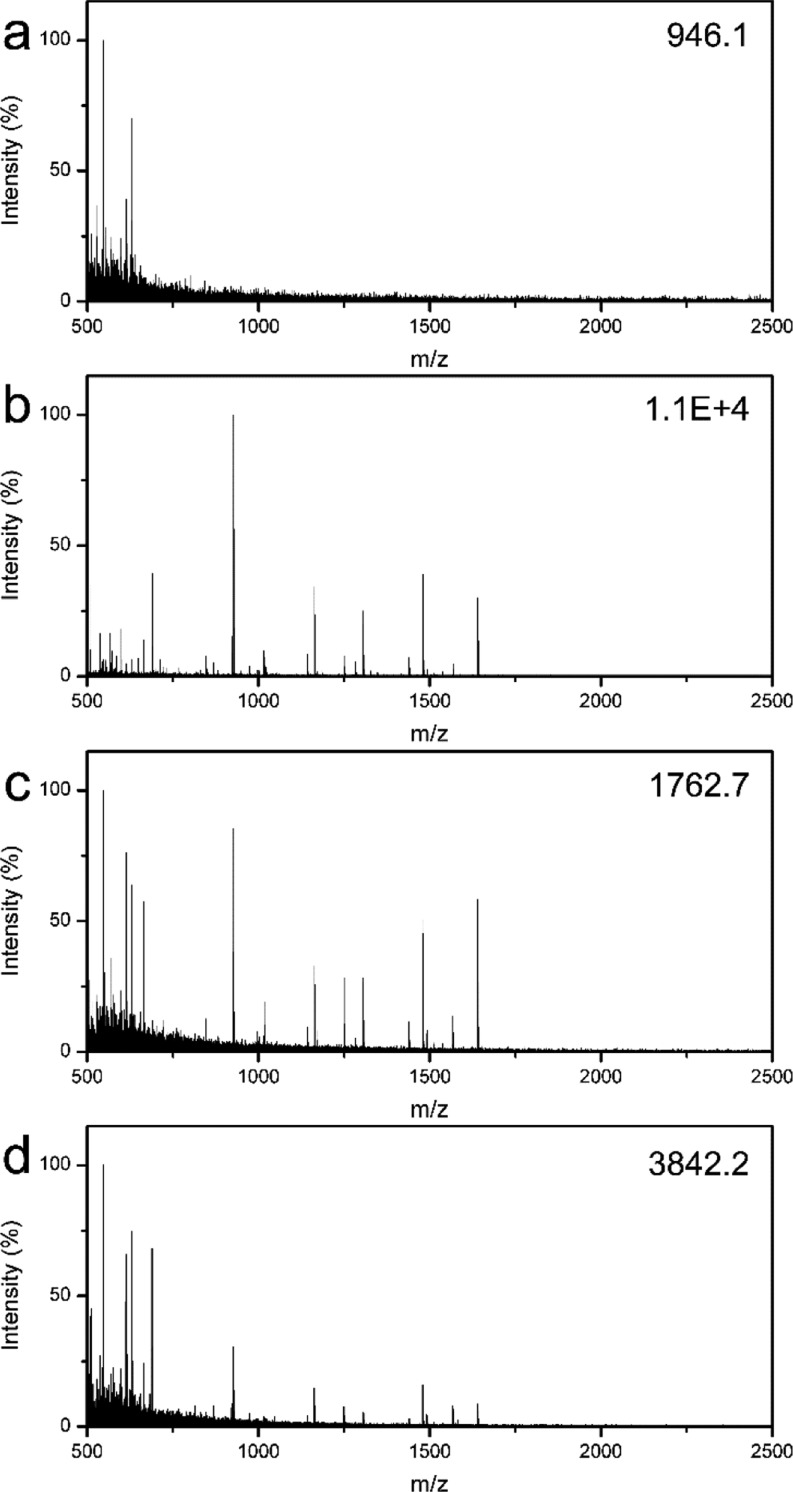
Figure 8.
MALDI-TOF mass spectra of the diluted BSA digest (2.5 nM): direct detection (a) and after enrichment with the MHM affinity microspheres (b), the magnetic mesoporous silica microspheres (c), and the ZipTip C18 pipet tip (d), respectively. The number in the top right corner is the highest peak intensity.

