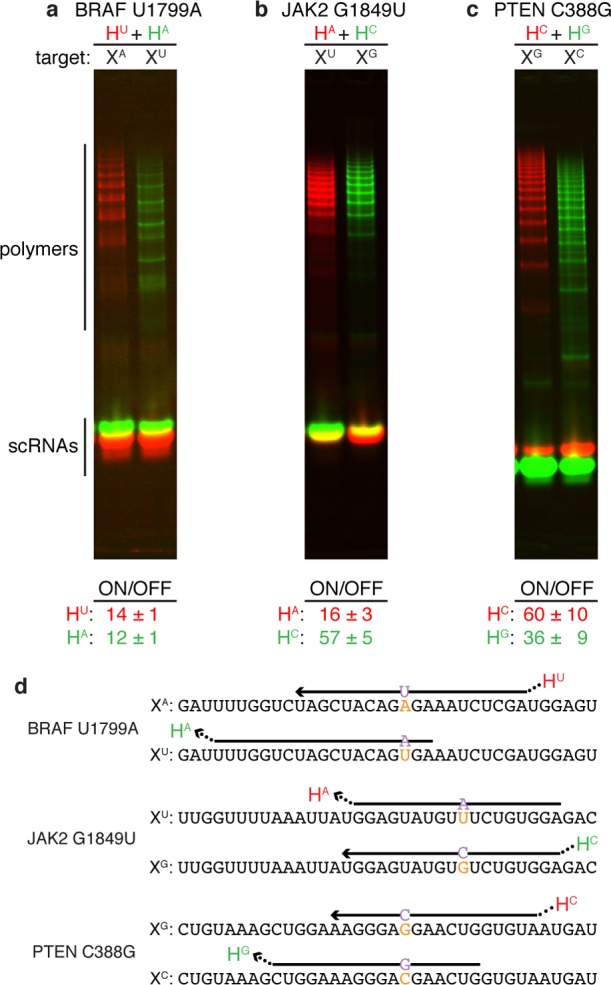
Figure 3.

Discrimination of RNA SBS cancer markers and wildtype sequences: (a) BRAF U1799A, (b) JAK2 G1849U, (c) PTEN C388G. Each reaction contains two HCR systems labeled with spectrally distinct fluorophores, one targeting the SBS cancer marker (red channel) and one targeting the corresponding wildtype sequence (green channel): (a) HU labeled with Cy3, HA labeled with Cy5. (b) HA labeled with Alexa647, HC labeled with Alexa488. (c) HC labeled with Cy5, HG labeled with Cy3. Top: Native PAGE. Bottom: Typical ON/OFF ratio for each HCR system (median ± median absolute deviation for N = 5 experiments). All targets and scRNAs at 1 μM except scRNAs of system HA of panel (a) at 2 μM to shift the selectivity window earlier in time. Reactions run for 2 h (panel a) or 1 h (panels b and c) in 1× PKR at 37 °C. (d) Target sequences depicted 5′ to 3′ with nucleotide variants in orange. For each target, the input domain of the cognate detecting scRNA is depicted with the location of the output domain indicated by an ellipsis. See Supporting Information Table S3 for scRNA sequences and label locations; see Supporting Information Section S2 for quantification details and additional data.
