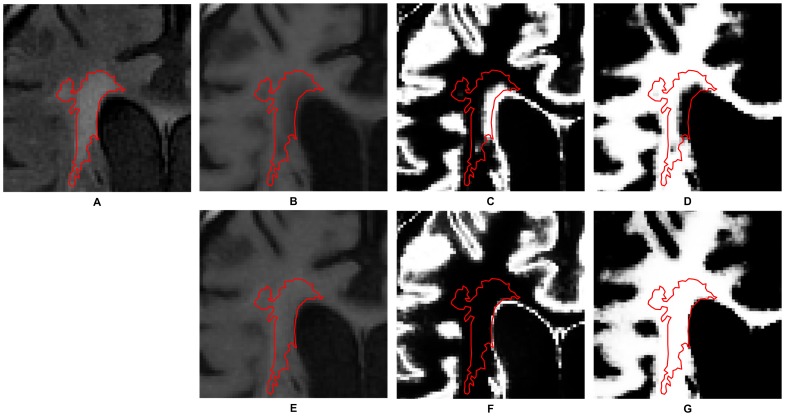
Figure 2. The effect of fusing T1w and FLAIR images.
The red contour in these images represents the position of WMHs delineated semi-automatically by the experienced neurologist. (A) An FLAIR image. (B) The registered T1w image. (C) The probabilistic map representing the gray matter segmented from B. (D) The probabilistic map representing the white matter segmented from B. (E) The registered T1w image after being fused with the FLAIR image. (F) The probabilistic map representing the gray matter segmented from E. (G) The probabilistic map representing the white matter segmented from E. Note that in the probability maps, higher intensity corresponds to higher probability.

