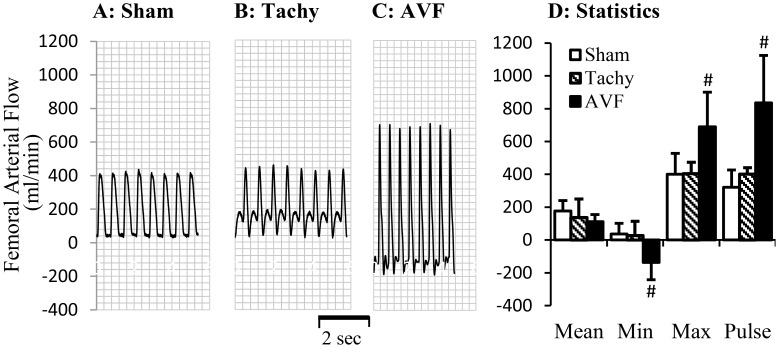
Figure 3. Blood flow in femoral artery at day 28.
A representative tracing of blood flow inform A: sham animal; B: tachycardia animal; C: volume-overload animal. D: Statistical data (mean±SD) of blood flow at day 28. Pulse flow is defined maximal flow to minus minimal flow. Sham, sham group; Tachy, tachycardia group; VOL, volume-overload group. *: p<0.05, Student's t-test in comparison with sham.

