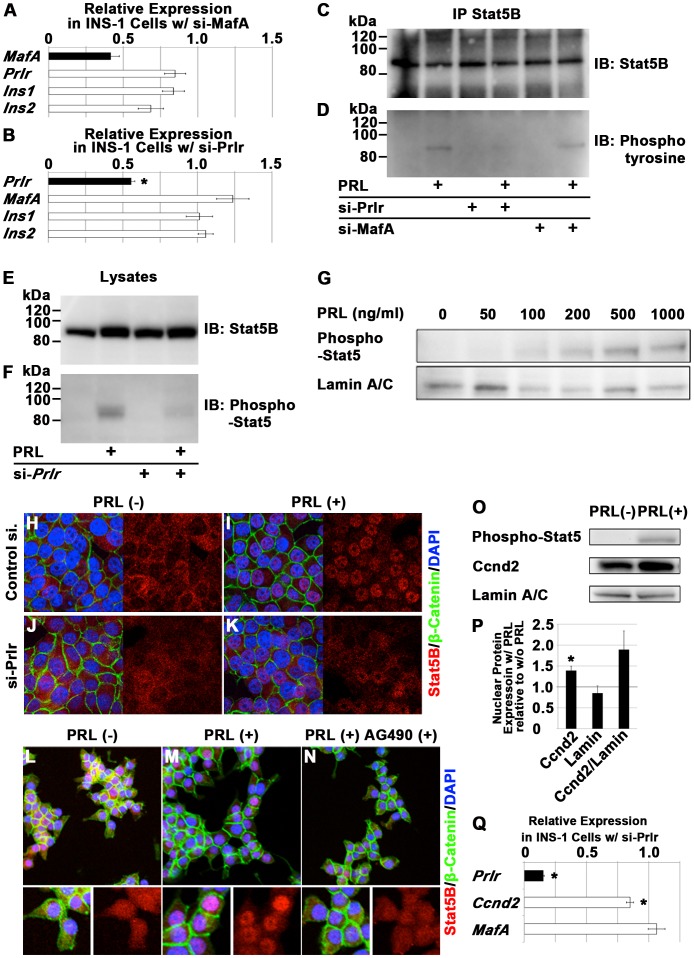
Figure 3. Regulation of Ccnd2 expression by prolactin signaling in β-cells.
(A, B) mRNA expression of the indicated molecules in INS-1 cells transfected with siRNA targeting MafA (A) or Prlr (B) relative to INS-1 cells transfected with control siRNA. n = 4 for both (A) and (B). (C–P) INS-1 cells were transfected with control siRNA or siRNA targeting Prlr (si-Prlr) or MafA (si-MafA). At 48 hours after transfection, the cells were cultured in defined serum-free medium for 24 hours for serum deprivation, followed by the addition of prolactin (PRL) or PBS as a control. (C, D) The immunoprecipitates obtained with anti-Stat5B antibody from 1% TX-100 soluble fractions of INS-1 cells transfected with control si-RNA, si-Prlr or si-MafA, and with or without PRL stimulation were immunoblotted with either anti-Stat5B (C) or anti-phosphotyrosine antibody (D). n = 3. (E, F) 1% TX-100 soluble fractions of INS-1 cell lysates were immunoblotted with either anti-Stat5B (E) or anti-phosphorylated Stat5 antibody (F). n = 3. (G) Dose-dependent effects of PRL on the phosphorylation of Stat5. n = 2. (H–K) Localization of Stat5B (red), β-catenin (green) and nuclei, which were counterstained with DAPI (blue), in INS-1 cells that were transfected or not with si-Prlr and stimulated or not with PRL. n = 3. (L–N) Localization of Stat5B (red), β-catenin (green) and nuclei, which were counterstained with DAPI (blue), in INS-1 cells with or without PRL stimulation and with or without exposure to AG490, a Jak2 inhibitor. n = 3. (O, P) The amount of phosphorylated Stat5, Ccnd2 and Lamin A/C (control) in the nuclear fraction of INS-1 cells with (w/) or without (w/o) PRL stimulation after serum deprivation (O), and quantification of the results (P). n = 4. (Q) mRNA expression of the indicated molecules in INS-1 cells transfected with siRNA targeting Prlr relative to INS-1 cells transfected with control siRNA. n = 3 for each molecule. The data represent the mean ± S.E.M. in (A), (B), (P) and (Q), and representative results are shown in (C–O). Asterisks means p<0.05.

