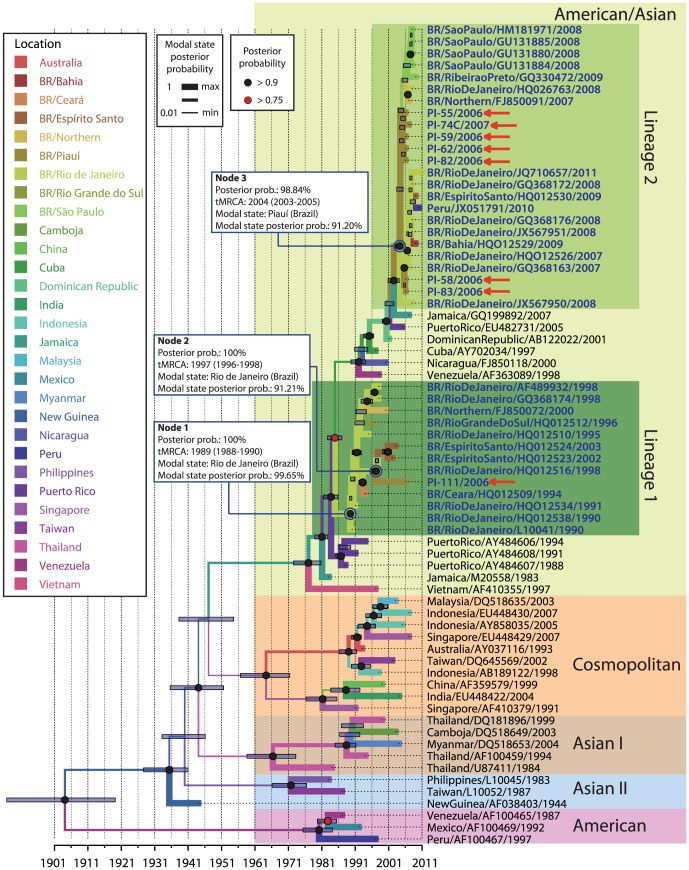
Figure 2. Evolutionary relationship between DENV-2 isolates from Piauí and the five genotypes of DENV-2.
A maximum clade credibility (MCC) tree was selected after Bayesian inference analysis (strict molecular clock; TN93+G; 400,000,000 iterations) of 72 DENV-2 envelope sequences. The five DENV-2 genotypes (American-Asian, American, Asian I, Asian II and Cosmopolitan) are highlighted in different colors. Brazilian isolates (bold blue letters) clustered within the American-Asian genotype and could be divided into two groups: lineage 1(dark green block) and lineage 2 (light green block). Each node is represented by colours black and red ( ), which presented posterior probability value>0.9 and >0.75, respectively. Blue bars represent the extent of the 95% highest probability density (95% HPD) for each divergence time. The most probable geographic state for each internal node was inferred by discrete phylogeographic analysis. Different colors in the branch represent distinct geographical states according to the legend on the left side of the figure. Branch width is proportional to the probability value of the inferred ancestral geographical state.

