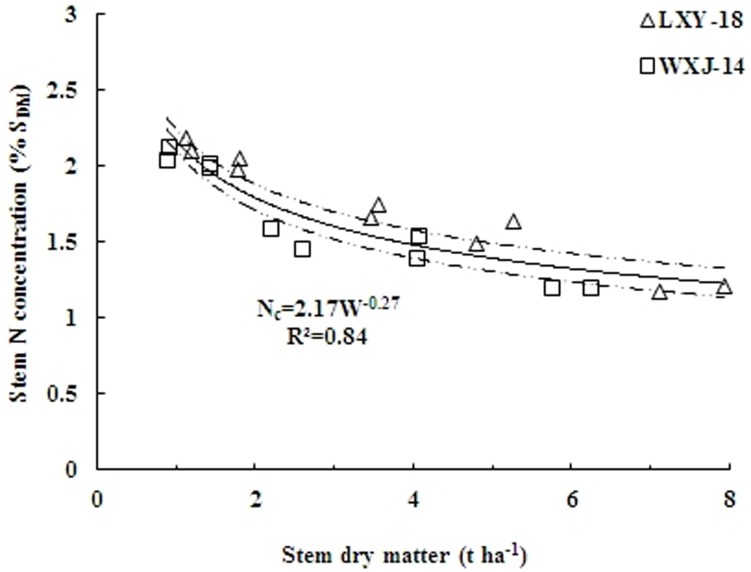
Figure 3. Critical nitrogen data points used to define the Nc dilution curve when data were pooled over for two rice cultivars (LXY-18 and WXJ-14).
The solid line represents the Nc dilution curve (Nc = 2.17W−0.27; R2 = 0.84) describing the relationship between the Nc and stem dry matter of rice. The dotted lines represent the confidence band (P = 0.95).

