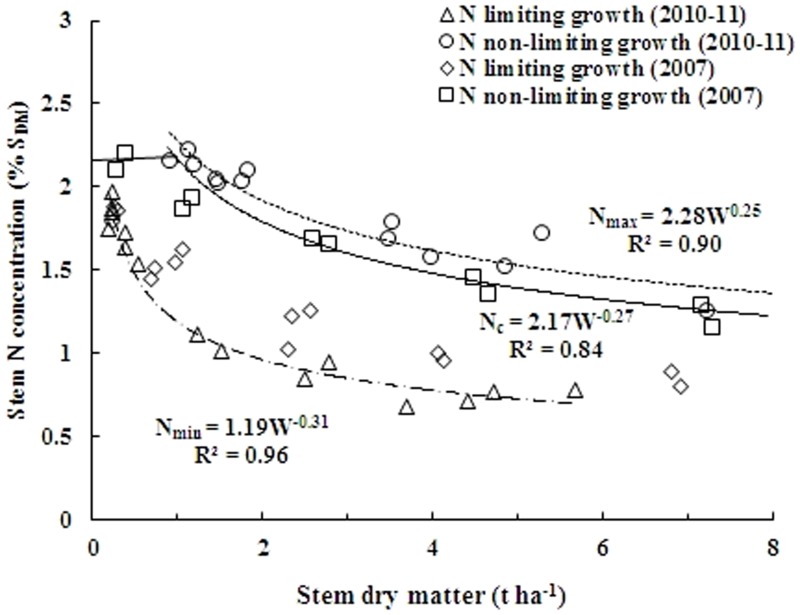
Figure 4. Comprehensive validation of Nc dilution curve using independent data set from experiment conducted in 2007.
Data points (◊) represent N limiting growth conditions, while (□) represent N non-limiting conditions. The solid line in the middle represents the Nc curve (Nc = 2.17W−0.27) describing the relationship between the Nc and stem dry matter of rice. The data points (Δ) and (○) not engaged for establishing the parameters of allometric function (2010 and 2011) were used to develop two boundary curves, (–•–•–•) minimum limit curve (Nmin = 1.19 W−0.31) and (------) maximum limit curve (Nmax = 2.27W−0.25).

