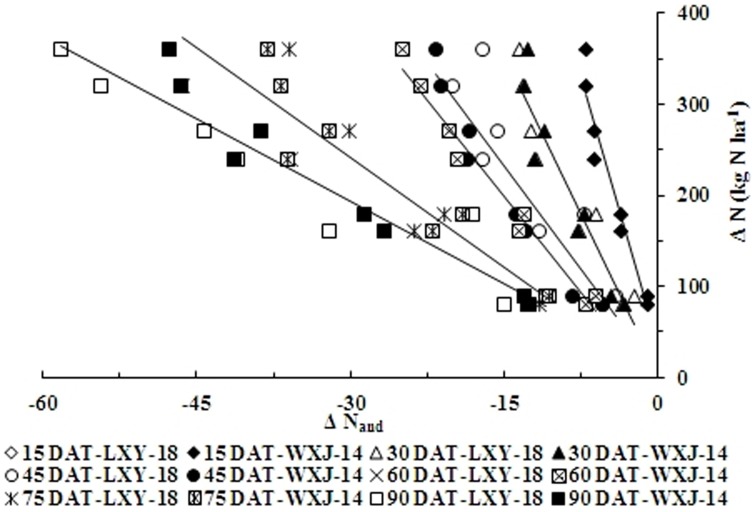
Figure 8. Relationship between changes of accumulated N deficit (ΔNand) and changes of nitrogen application rates (ΔN, kg N ha−1) at different growth stages in experiments conducted during 2010 and 2011.
The open symbols represent different growth stages for LXY-18 while filled symbols represent different growth stages for WXJ-14 (ΔN = C×ΔNand+D; C = 18.97 ln(DAT)-89.22, R2 = 0.98 and D = −9.98 ln(DAT)+52.76, R2 = 0.19), respectively.

